
Most digital marketing plans list channels. A working plan assigns each channel a job in the funnel, a short list of numbers that prove it's doing that job, and a routine for fixing it when it isn't. That's the whole framework: implement by funnel stage, track by funnel stage, and work on the gap between target and result.
The funnel has four core stages, plus a fifth that many teams add:
- Awareness: the buyer notices a problem or a brand.
- Interest: the buyer researches solutions.
- Desire: the buyer wants a specific offer.
- Action: the buyer converts.
- Retention and advocacy: the buyer stays and tells others.
Where should the framework start?
Start with the business, before any channel. Four questions do most of the work:
- What are the business's current goals and priorities, and why?
- What is the current sales motion, and why?
- Has product-market fit been confirmed, and who are the ICP, the buyer personas and their top three pain points?
- Is there a repeatable sales cycle pattern?
Then write objectives and key results. A key result is an outcome you can measure. If the objective is to increase brand authority in the tech industry, "launch three content campaigns" is a task and "get more followers" is a vanity metric. "Secure 10 guest post placements in top-tier industry publications this quarter" is a key result, because it proves the objective moved.
Which channel does which job in the funnel?
Think of the funnel as a relay race. Each channel runs its own leg and hands the buyer to the next one. Seven components cover the course, shown first as a funnel and then in detail:
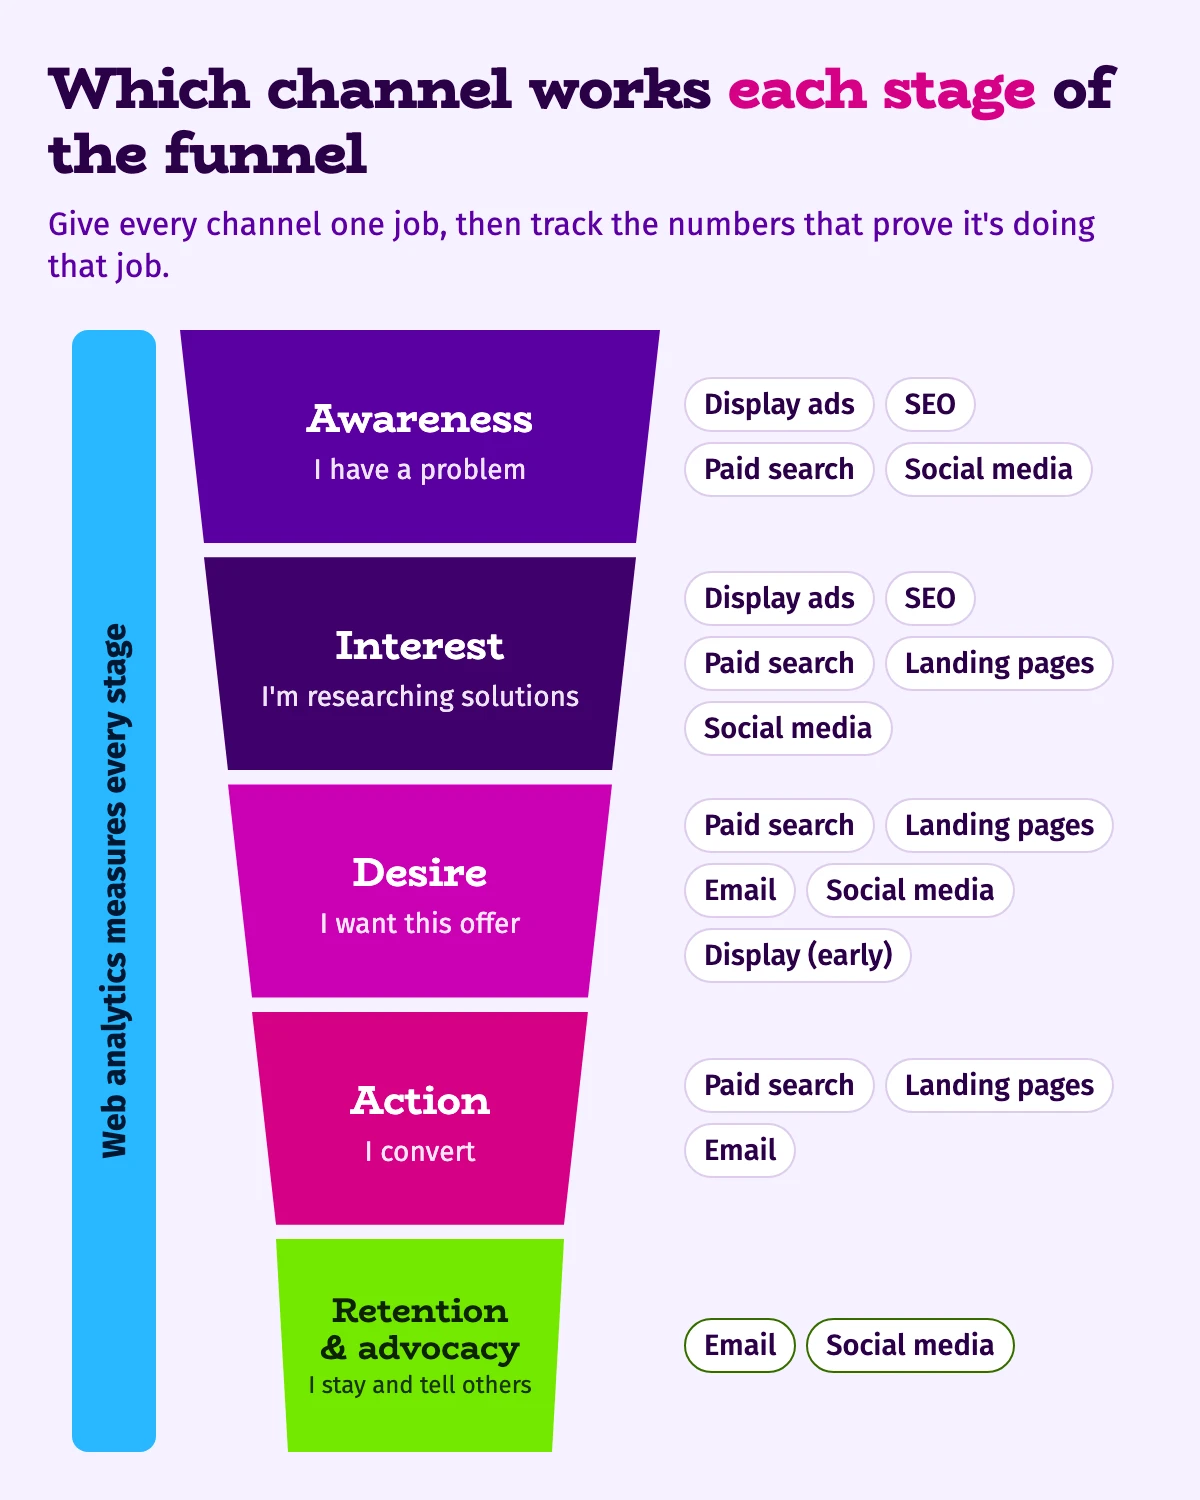
| Component | Funnel stages | Its job | What you build |
|---|---|---|---|
| Display advertising | Awareness, Interest, early Desire | Attract attention and convey the brand message | Brand visuals, succinct copy, a clear CTA, offers and urgency cues |
| Web design and landing pages | Interest, Desire, Action | Convert visitors with a page aligned to the ad | Layout for usability, visual hierarchy, trust signals, answers to objections |
| SEO | Awareness, Interest | Attract relevant organic traffic | Educational content, meta tags and headings |
| Paid search | Awareness through Action | Drive targeted traffic and conversions | Keyword-matched ad copy and aligned landing pages |
| Email marketing | Desire, Action, Retention | Nurture leads and keep customers | Responsive, branded, personalized, segmented emails |
| Social media | Awareness, Interest, Desire, Retention | Build presence and community | Images, video, stories, polls and Q&A |
| Web analytics | All stages | Measure behavior and campaign effectiveness | Tracking and reporting |
Three rules come out of the table.
Match the message to the stage. SEO content at the top of the funnel is educational and solves problems. Display and paid search add unique selling points and offers such as a free trial. Email at the bottom mixes educational, promotional and transactional messages, timed to where the customer is in the journey. Social media keeps one brand voice and a community-building, customer-support tone, with calls to action for engagement or conversion.
Protect the handoffs. Paid search and display both hand visitors to a landing page. Its messaging has to match the ad that sent them.
Treat analytics as the referee. Web analytics produces no creative and no message. It runs the length of the funnel and tells you which leg is slowing the race.
What should you track at each stage?
Keep the dashboard to four groups of metrics: traffic, engagement quality (how long visitors stayed and what they did), conversions and return on investment. Then give each channel the formulas that match its job.
- Click-through rate: clicks divided by impressions. It measures whether an ad or link earns traffic.
- Conversion rate: conversions divided by clicks. It measures whether traffic turns into action.
- Cost per click: the CPM divided by clicks per 1,000 impressions.
- Cost per acquisition: the CPM divided by conversions per 1,000 impressions.
- Return on ad spend: revenue from ads divided by ad spend.
- Bounce rate: single-page visits divided by total visits, which matters for SEO and landing pages.
- Open and unsubscribe rates: opens or unsubscribes divided by emails delivered.
A worked example shows how the numbers connect. An advertiser pays a $20 CPM and gets a 0.8% click-through rate: 8 clicks per 1,000 impressions, or $2.50 per click. With a 2.3% conversion rate, those 8 clicks produce 0.184 conversions, which puts the cost per acquisition at $108.70. Drop the click-through rate to 0.6% and the cost per click rises to $3.33 with the same CPM.
Social media needs a tracking layer of its own. Monitoring tools capture brand mentions by context, sentiment, platform and engagement, including conversations that never name the brand. Arby's found through that kind of monitoring that one-third of its brand mentions were about its sauces, and the insight led to new products. Pick the tool by objective: a comprehensive platform such as Sprout Social for ongoing brand health, native platform analytics for real-time engagement, and a mention tracker such as Google Alerts for web-wide reputation.
Retail media networks take the idea furthest. In Adtelligent's Retail Media Market Outlook 2026, Anna Sursaieva writes: "Retail media is driven by measurable ROI, first-party data, and closed-loop attribution."
How do you work on what the numbers show?
A missed target is a question, and variance analysis is the way to answer it. Work through five steps:
- Collect the data: sales reports, customer feedback and market analysis.
- Set the baseline: targets from historical data or industry benchmarks.
- Compare actual to target: size the gap and mark it positive or negative.
- Find the root cause: ask "why" five times, or map causes on a fishbone diagram.
- Recommend the action: one specific change tied to the cause.
Root causes fall into three families. Market conditions cover competition and demand. Operational efficiency covers things like delayed content that pushes a campaign past its window. Customer behavior covers shifts such as buyers moving to mobile while your ads still target desktop.
Once you know the cause, the formulas point to the lever. Better creative and targeting raise click-through rate, which lowers cost per click. Better landing pages and offers raise conversion rate, which lowers cost per acquisition. Adjust bids and budgets after that, based on where cost per click and cost per acquisition land.
Test one element at a time. If an email variant lifts opens by 50% and clicks stay flat, the subject line worked and the body copy didn't. Change both at once and you learn nothing.
Key takeaways
- Start from business goals and key results that measure outcomes.
- Give every channel one funnel job and a message to match it.
- Track traffic, engagement quality, conversions and ROI, with formulas per channel.
- Diagnose every missed target with baseline, comparison and root cause.
- Raise click-through and conversion rates, then adjust bids and budgets.
If your channels are live and nobody can say which funnel stage each one serves, bring your current dashboard to a free 30-minute call. We'll map each channel to its stage, pick the numbers that belong on the dashboard, and you'll leave with a tracking plan your team can run.